
The Detroit Lions added three players to injured reserve a couple days ago. Here is the analysis for each, followed by a look at some interesting data charts regarding the Lions that can lead to faulty conclusions.
Lions Injured Reserve Additions
Ben Bartch, OG - Foot
Projected Return-to-Play (RTP): Uncertain. Could be out for season.
Bartch was on my IR-watch when he showed up on the injury report after Week 2 with a foot injury. After missing the last three games, he finally was put on IR. A delayed placement on IR can be due to an uncertain prognosis (see Kerby Joseph last year) or a change in management plan - neither of which is a good sign for an early return to the field.
Bartch had a Lisfranc foot surgery in December 2025 with a slow recovery that limited him during the 2026 offseason and into training camp. There are no details for the current foot issue, but it seems likely to be related to the Lisfranc. Based on all this evidence, I think there is a chance that Bartch is getting another surgery and will be done for the season.
Tom Kennedy - Right MCL surgery
Projected RTP: Out for season. Should be ready for 2027 offseason.
This MCL injury turned out to be severe enough to require surgery and end Kennedy’s season. He is a free agent after this season, but the Lions might bring him back once again.
Devin White, LB - Left forearm fracture
Projected RTP: Late November, around Week 12-13.
White has likely already had a plate and screws surgically placed for his fracture. The fracture should heal well and reliably, with a return at around 7-8 weeks post injury.
For the up-to-date IR summary throughout the season, visit my Lions IR/PUP/NFI Tracker.
Now, let’s review some graphs and charts I found recently on the internet pertaining to the Lions, and see how they might be misleading…
Aidan Hutchinson Snap Counts vs Production
Graphs via @GridironGrading
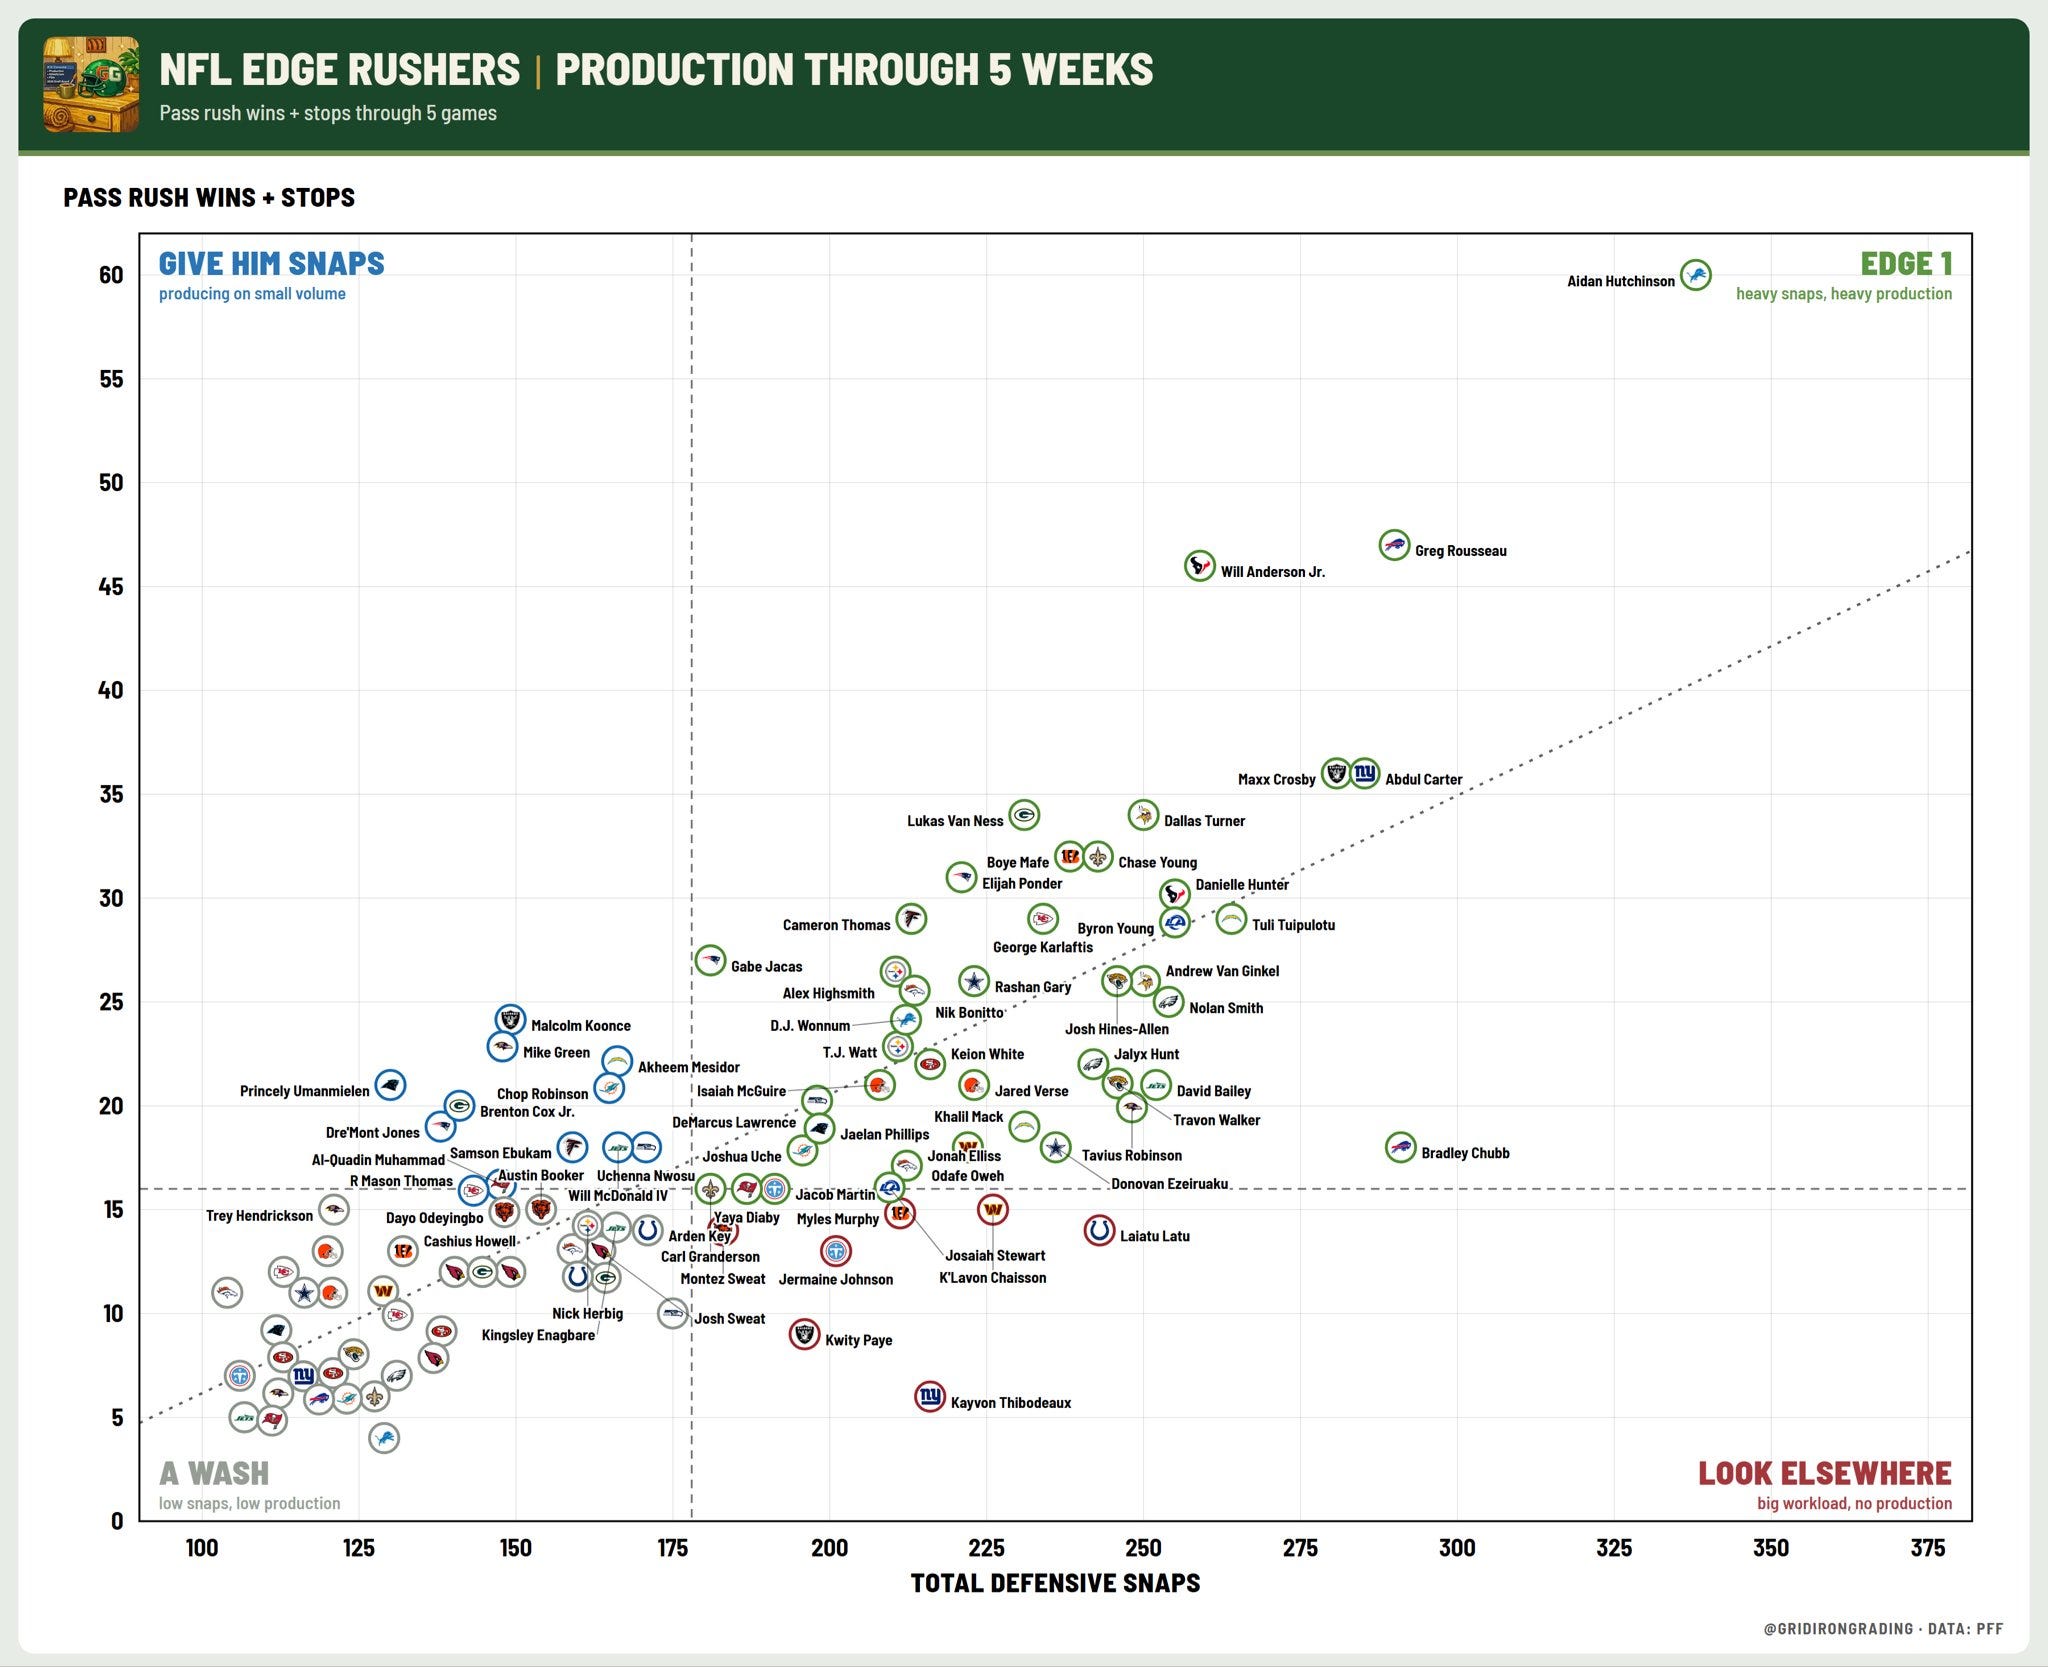
This graph has Total Snaps on the X axis and Production on the Y axis. Aidan Hutchinson is a far outlier in the top right corner. While a quick glance at the graph might give the impression that a player in the top right corner is a good thing, that isn’t entirely the case. That’s because the X-axis number (total snaps) is not necessarily a good thing.
The true ideal spot to be in for this graph is top middle, not top right. Top middle would mean a player is very efficient with a high production to snap ratio. Will Anderson is close to the ideal spot in this graph.
Being an extreme outlier to the right probably means that the player is playing too many snaps. That has been an issue for years with Aidan Hutchinson…

Why are too many snaps an issue? In an ideal world where injuries don’t exist, it would not be an issue - although I would still argue that fewer snaps would actually increase his production. In the real world of injuries, all those extra snaps increase the risk of a fluke or cumulative injury that makes a player unavailable later in the season and into the playoffs.
The same goes for Alim McNeill’s graph below…
Alim McNeill Snap Counts vs Production
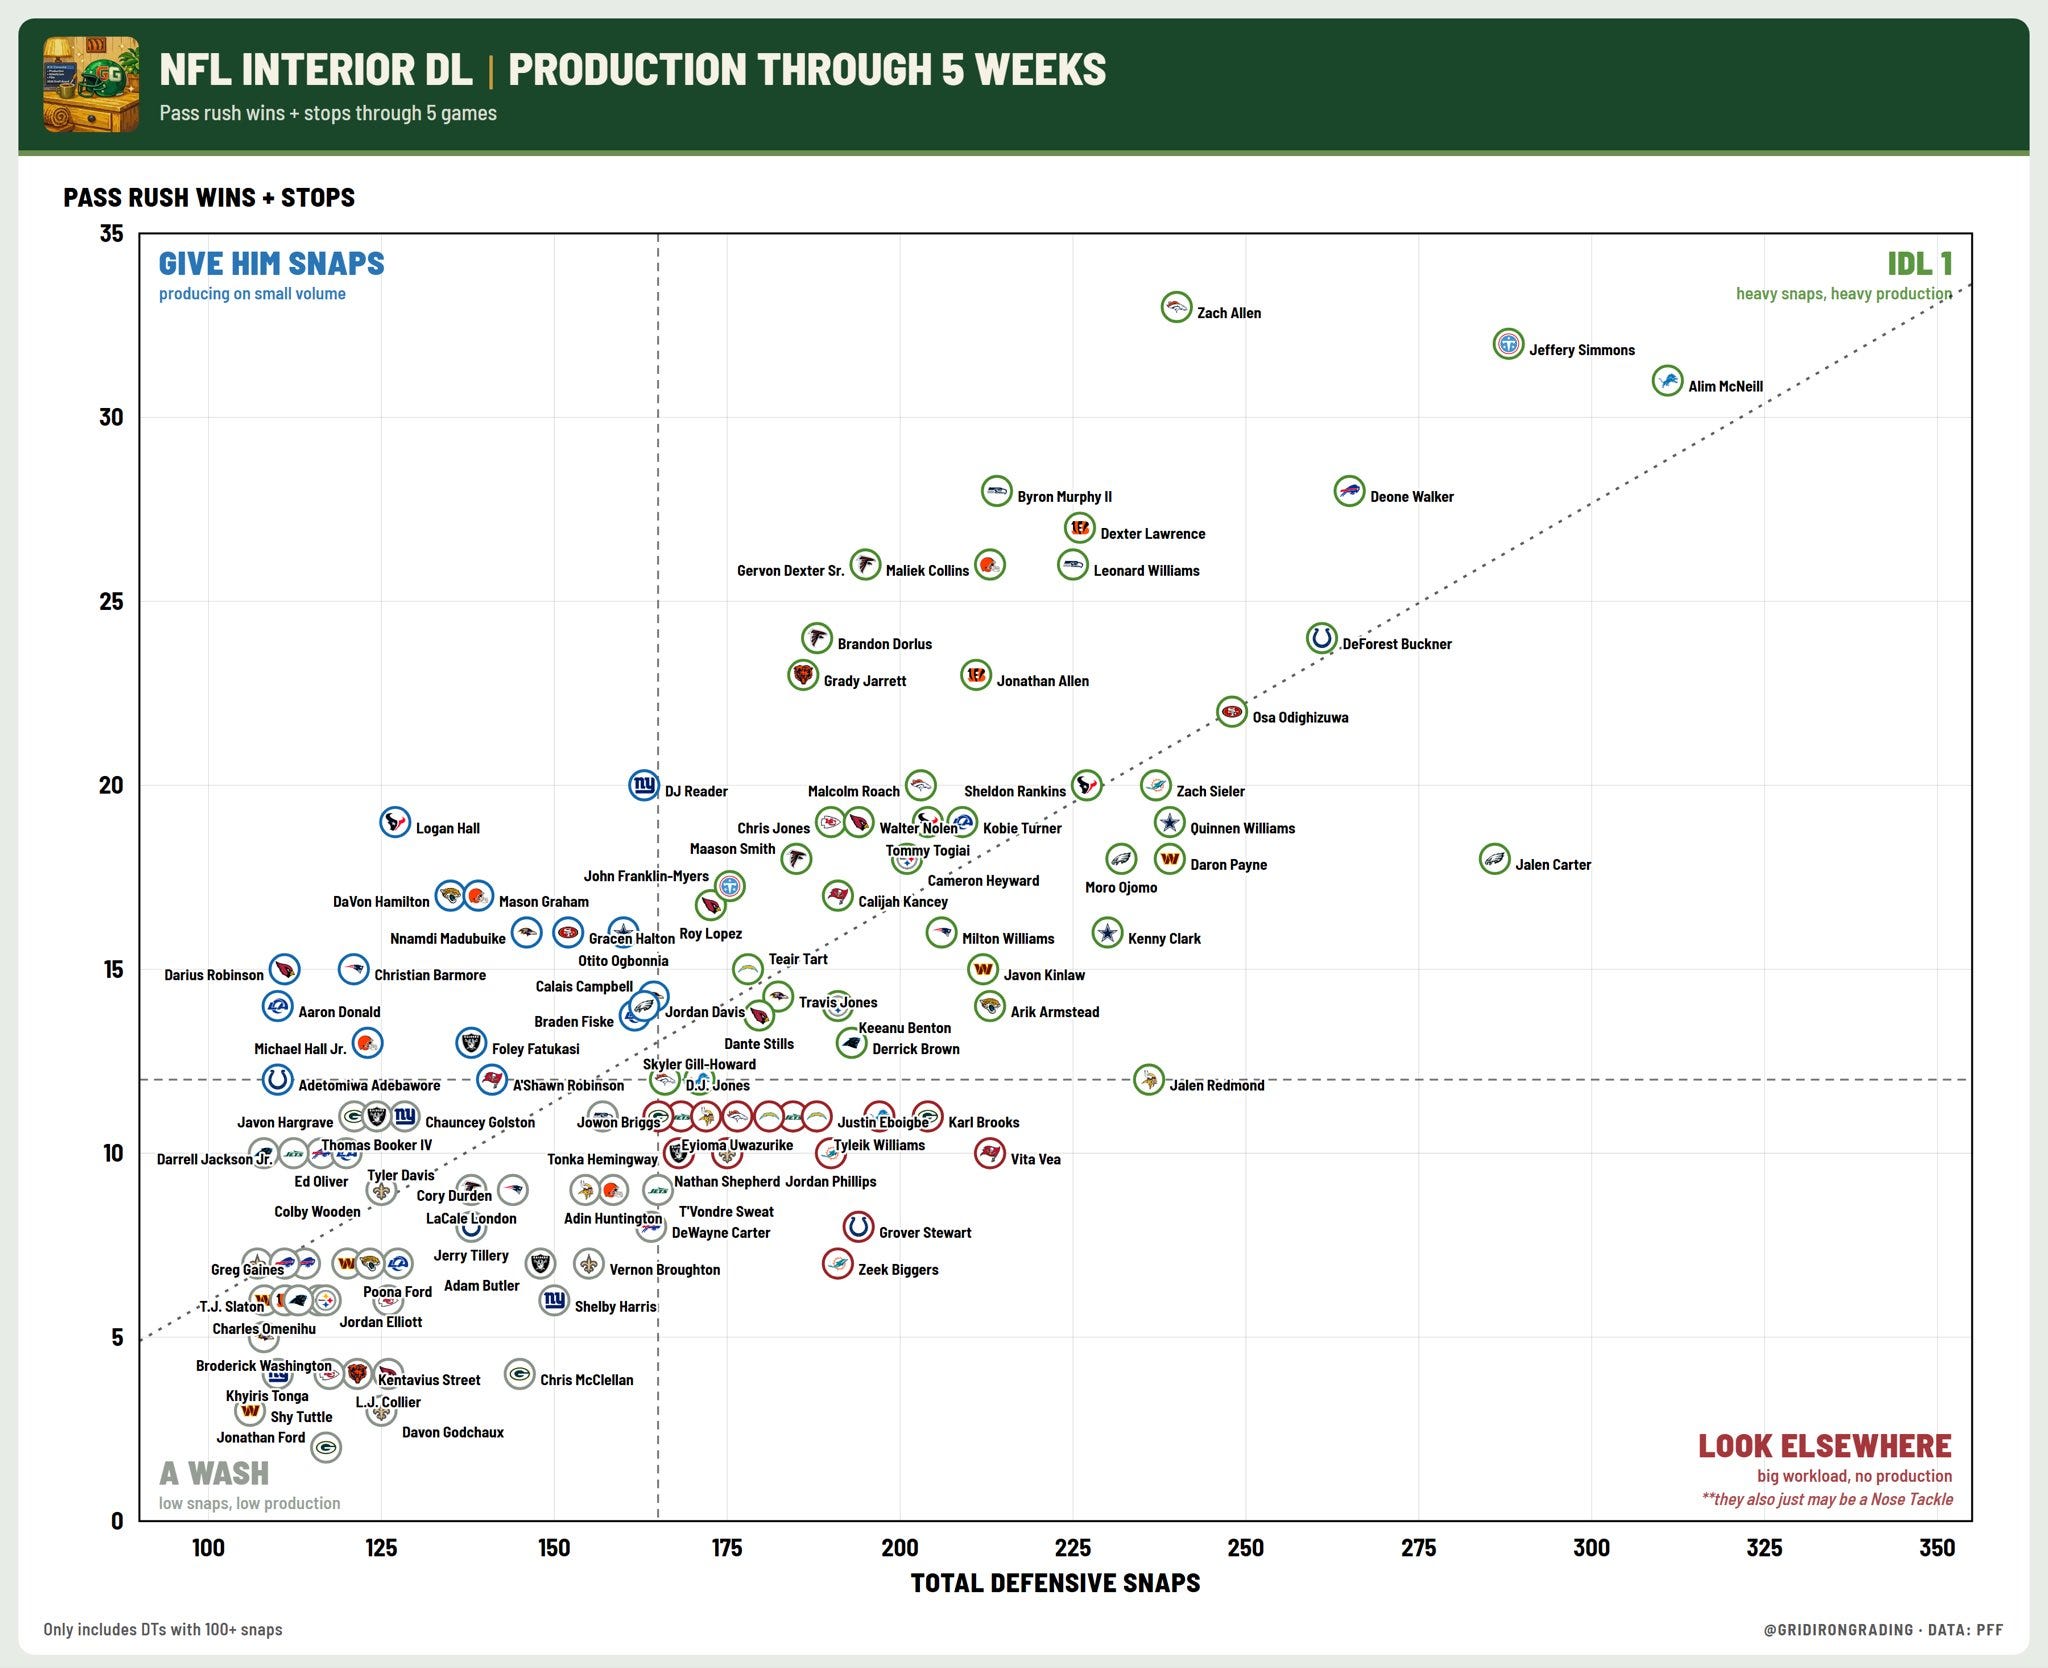
McNeill is in the same top right area as Hutchinson and is the rightmost outlier. Again, not a good thing. The ideal spots would be where Byron Murphy and Zach Allen are located.
Data, We Have a Problem
Given the proliferation of stats and numbers constantly spewed out in the NFL media landscape, here is a good reminder that the data can be flawed. The following is a chart I saw on X that ranked teams by number of games that starters have missed.

This chart claims that the Lions have lost 27 games due to starter injuries this season - tied for most in the NFL. Many will see this as further proof that the Lions are an injury-ridden team. But the problem is that the numbers here are completely wrong.
If you count last year’s injuries, here is the count:
Branch 5 games lost
Joseph 5
Mays 5
Miller 1
Mahogany 1
Total = 17
If you don’t count last year’s injuries:
Maddox 3
Mays 5
Miller 1
Mahogany 1
Total = 10
There is subjectivity in how you count the games lost due to injury. Rock Ya-Sin was a starter at the beginning of the season, but not when he missed a game. Do you count last season’s injuries? How much do you count Avonte Maddox, who may have lost his starting job at some point?
Regardless of how you count it, these totals are nowhere close to 27 starter games lost. Even if you play fast and loose with the roster depth chart by counting DE Payton Turner as a starter, you still can’t get to that number. You would need to get very creative by counting Taylor Decker and/or Frank Ragnow to somehow get to 27.
Moral of the story is to be careful of data you see posted on the internet.
The data bottom line: Wins and Losses.